Building a high quality portfolio at Lloyd’s
The underwriting results of the Helios portfolio have consistently outperformed the Lloyd’s market average, with the average return being 9% higher than the Lloyd’s average (last five years).
These incremental returns demonstrate the diversity and the breadth of underwriting expertise within the businesses comprising the portfolio of syndicate capacity.
Shares in Helios Underwriting PLC provide investors with a simple, low cost way of getting exposure to the Lloyd’s insurance market through a diverse spread of syndicates.
John Chambers
Executive Chariman
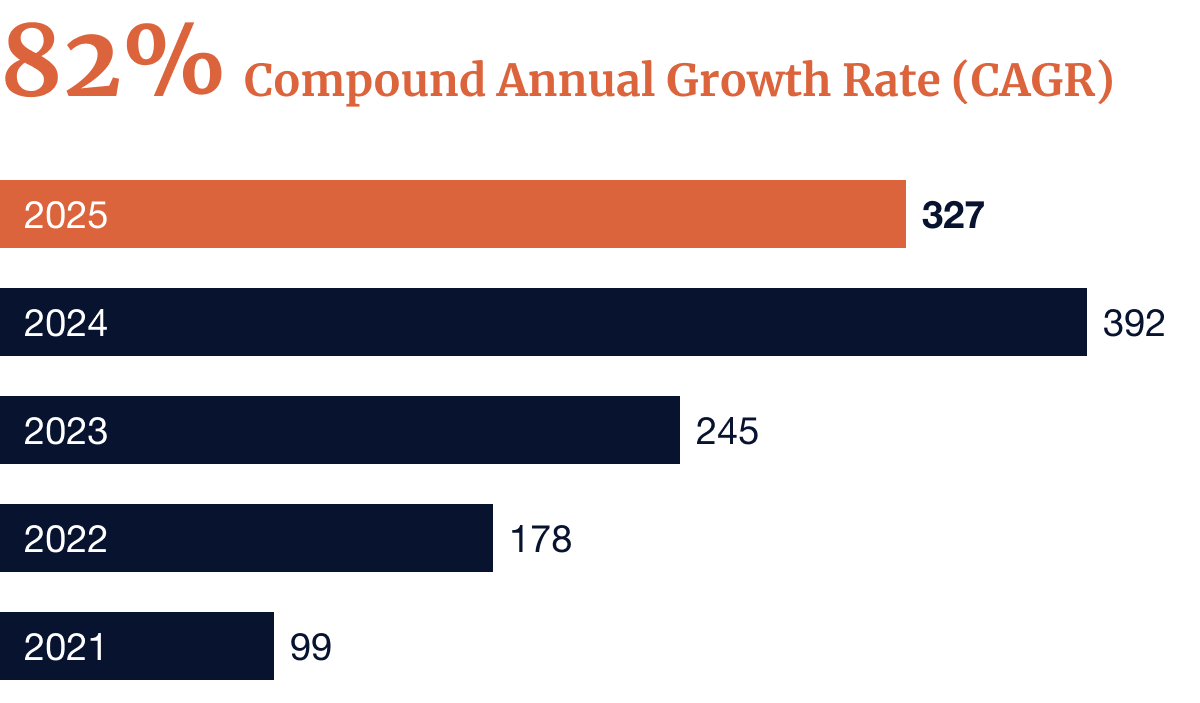
Growth in retained capacity
£m
Net Tangible Asset Value per Share
(current estimate in pence)
Helios portfolio
Total holdings by Managing Agent (Jan 2025)
| Syndicate | Managing agent | Capacity £M | Helios portfolio % of total |
|---|---|---|---|
| 33 | Hiscox | 15.11 | 3.12 |
| 218 | ERS | 19.4 | 4.01 |
| 318 | Cicinnati | 1.08 | 0.22 |
| 386 | QBE | 2.89 | 0.6 |
| 510 | TMK | 15.31 | 3.16 |
| 609 | Atrium | 18.79 | 3.88 |
| 623 | Beazley | 28.87 | 5.96 |
| 727 | Meacock | 2.96 | 0.61 |
| 1176 | Chaucer | 2.58 | 0.53 |
| 1609 | Mosiac | 20 | 4.13 |
| 1729 | Dale | 25.12 | 5.19 |
| 1902 | MCI | 12.64 | 2.61 |
| 1910 | Ariel Re | 20 | 4.13 |
| 1925 | Envelop | 7.5 | 1.55 |
| 1955 | Arch | 24.64 | 5.09 |
| 1966 | MCI 2 | 12.6 | 2.6 |
| 1971 | Apollo | 25 | 5.16 |
| 1985 | Flux | 12.69 | 2.62 |
| 2024 | ADA | 6.75 | 1.39 |
| 2121 | Argenta | 5.21 | 1.08 |
| 2358 | Nephila | 25 | 5.16 |
| 1427 | Agile | 15 | 3.1 |
| 2454 | ASR | 7.5 | 1.55 |
| 2525 | Secure Lby Solutions | 2.41 | 0.5 |
| 2689 | HRP | 14.76 | 3.05 |
| 2791 | MAP | 16.17 | 3.34 |
| 3123 | Fidelis | 14.06 | 2.9 |
| 3939 | Norman Max | 12 | 2.48 |
| 4242 | Beat | 16.52 | 3.41 |
| 5623 | Beazley | 26.84 | 5.55 |
| 5886 | Blenheim | 37.48 | 7.74 |
| 6103 | MAP | 4.62 | 0.95 |
| 6104 | Hiscox | 12.01 | 2.48 |
| 6117 | Ariel Re | 0.57 | 0.12 |
| Total Helios portfolio | 484 | 100 | |